Elevate Your WordPress
Hosting Game
WordPress-Level Protection
Site A
List of Active Plugins:
OTHER DETAILS:
Site B
List of Active Plugins:
OTHER DETAILS:
BuddyBoss Components:
Site C
List of Active Plugins:
OTHER DETAILS:
BuddyBoss Components:
BuddyBoss App Components:
Site D
List of Active Plugins:
OTHER DETAILS:
BuddyBoss Components:
BuddyBoss App Components:
LearnDash
Site E
List of Active Plugins:
OTHER DETAILS:
BuddyBoss Components:
LearnDash
Site F
List of Active Plugins:
OTHER DETAILS:
BuddyBoss Components:
BuddyBoss App Components:
LearnDash
Site G
List of Active Plugins:
OTHER DETAILS:
BuddyBoss Components:
BuddyBoss App Components:
LearnDash
Site H
List of Active Plugins:
OTHER DETAILS:
BuddyBoss Components:
BuddyBoss App Components:
LearnDash
Site I
List of Active Plugins:
OTHER DETAILS:
BuddyBoss Components:
LearnDash
Site J
List of Active Plugins:
OTHER DETAILS:
BuddyBoss Components:
TUTOR LMS:
Site K
List of Active Plugins:
OTHER DETAILS:
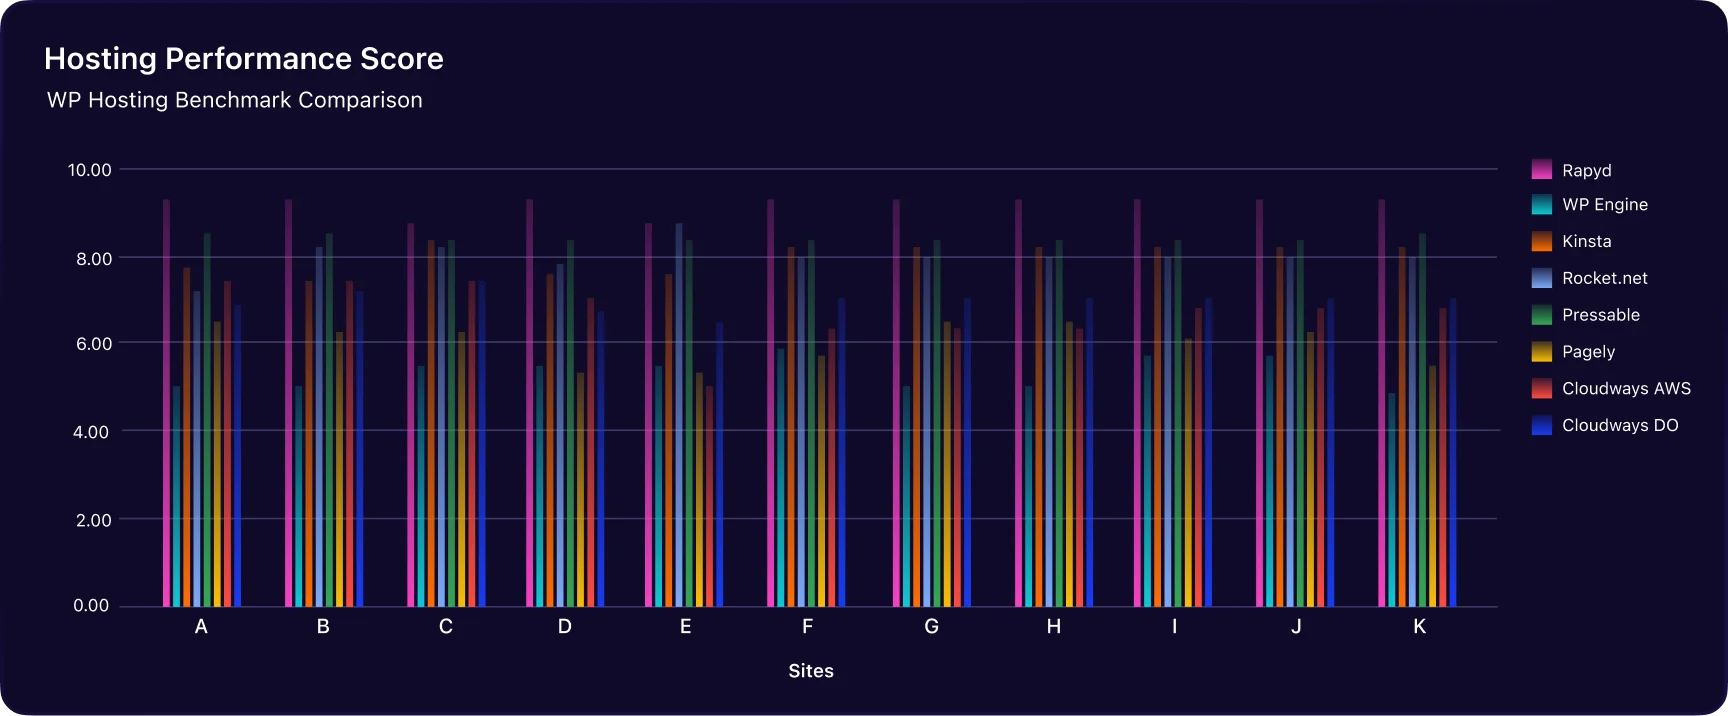
Rapyd Cloud excels in standardized WordPress hosting benchmarks, showcasing exceptional CPU performance, efficient memory usage, and swift filesystem operations. It leads with an impressive average score of 9.17, excelling in CPU, memory bandwidth, disk speed, persistent object cache, and network download speed, making it ideal for high-performance hosting needs.
The third-party plugin evaluates the performance of your WordPress hosting environment. It conducts a series of tests to measure the response time and capacity of your server, providing insights into how well your hosting can handle WordPress-specific tasks. You can also run your own tests by installing the plugin on your site.
WP Performance Tester
Site A
List of Active Plugins:
OTHER DETAILS:
Site B
List of Active Plugins:
OTHER DETAILS:
BuddyBoss Components:
Site C
List of Active Plugins:
OTHER DETAILS:
BuddyBoss Components:
BuddyBoss App Components:
Site D
List of Active Plugins:
OTHER DETAILS:
BuddyBoss Components:
BuddyBoss App Components:
LearnDash
Site E
List of Active Plugins:
OTHER DETAILS:
BuddyBoss Components:
LearnDash
Site F
List of Active Plugins:
OTHER DETAILS:
BuddyBoss Components:
BuddyBoss App Components:
LearnDash
Site G
List of Active Plugins:
OTHER DETAILS:
BuddyBoss Components:
BuddyBoss App Components:
LearnDash
Site H
List of Active Plugins:
OTHER DETAILS:
BuddyBoss Components:
BuddyBoss App Components:
LearnDash
Site I
List of Active Plugins:
OTHER DETAILS:
BuddyBoss Components:
LearnDash
Site J
List of Active Plugins:
OTHER DETAILS:
BuddyBoss Components:
TUTOR LMS:
Site K
List of Active Plugins:
OTHER DETAILS:
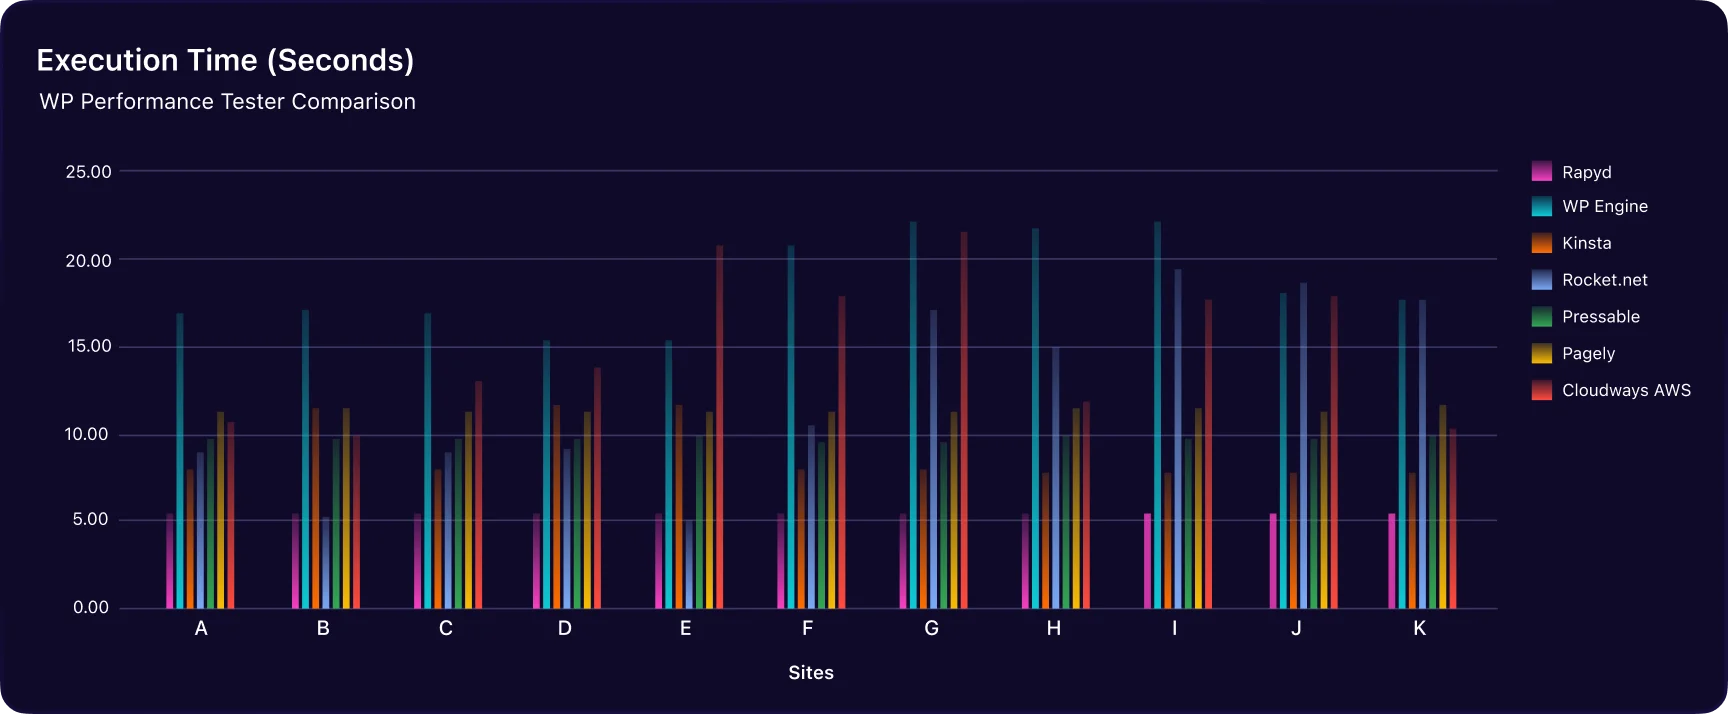
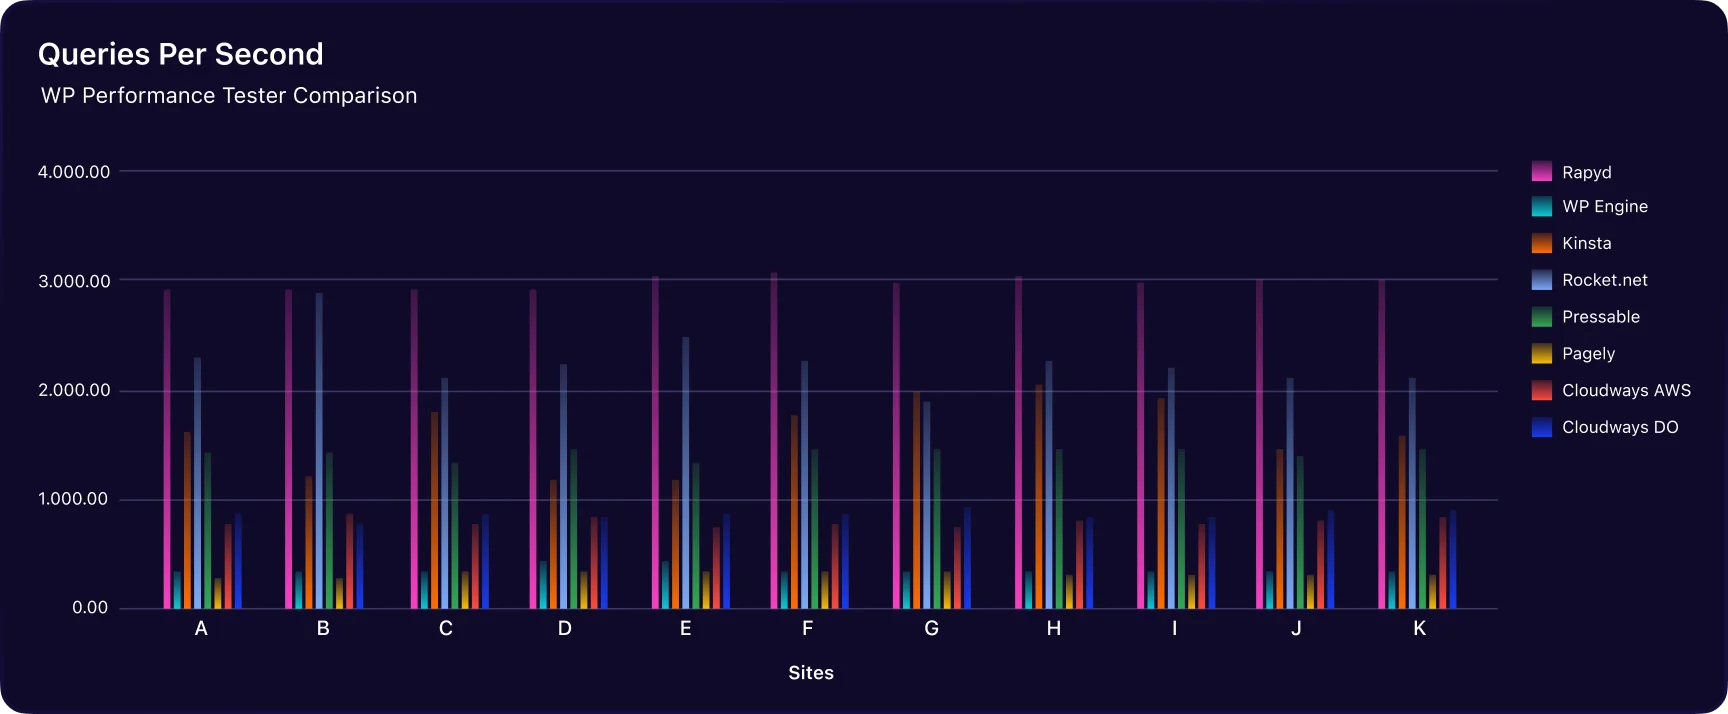
Through the WP Performance Tester, we demonstrate Rapyd’s robustness in handling complex queries and transactions at an unmatched pace. In the WordPress Performance Tester test, Rapyd stands out as the top performer with an average Queries Per Second score of 2,945 and the lowest Execution Time of 5.54 seconds, making it ideal for high-traffic and dynamic websites needing both robust query handling and fast execution times.
The third-party plugin assesses your WordPress site’s performance. It runs a series of tests to check the speed and efficiency of your WordPress environment, including server response times and database operations, helping identify areas for performance improvement. You can also run your own tests by installing the plugin on your site.
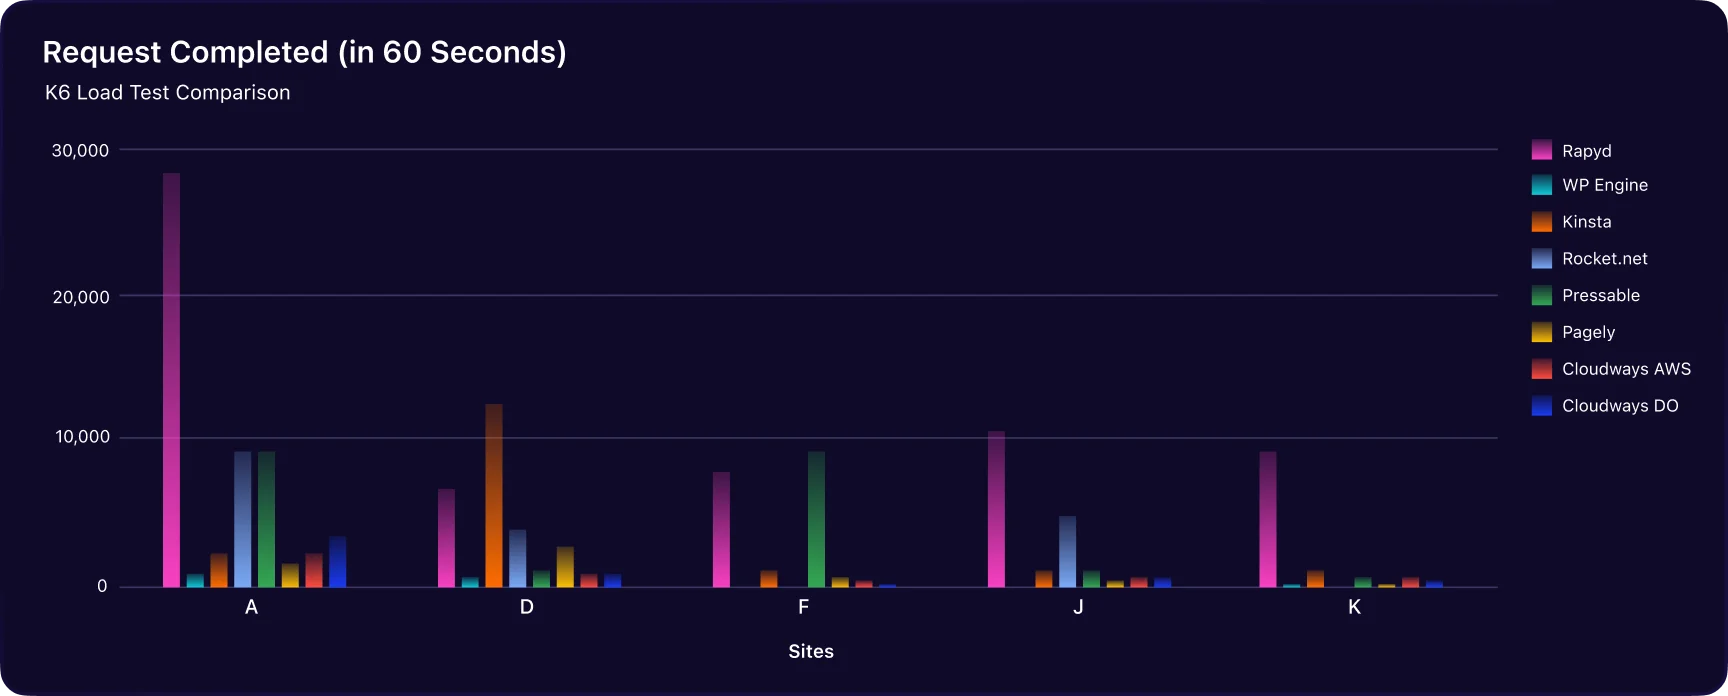
Based on the normalized requests processed within the test window, we then calculate an average possible page requests per second for the server. This calculation shows with some guidance the theoretical page requests per second any given hosting can achieve. Because this is a ramped load test, this number should be treated as a guidance. Many other factors can impact a server at runtime, but this number should be a realistic minimum achievable value.
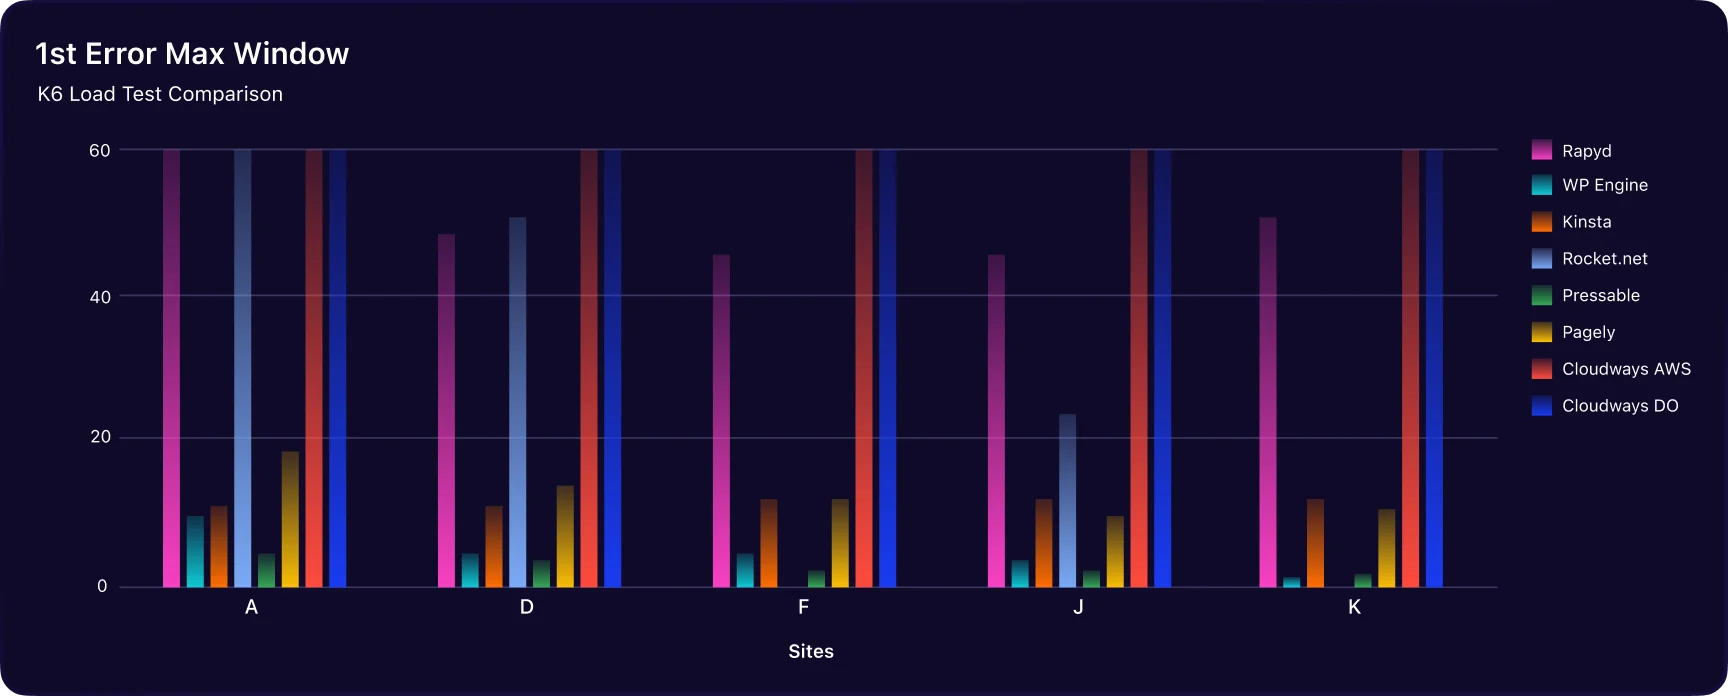
We track the point in time when a server first responds with a status other than 200.
We limit the number of error results recorded to 1 minute – as it is possible to receive requests well after the minute when a server is running slowly, but for the purposes of this test what we are looking for is when the server first starts to report errors within the minute, if it reports tests outside the minute we accept that they are beyond the bounds of the load test.
This shows the point in time within the test minute that a hosting first starts to report errors … the lower the error point that lower the number of concurrent requests the server is capable of handling reliably.
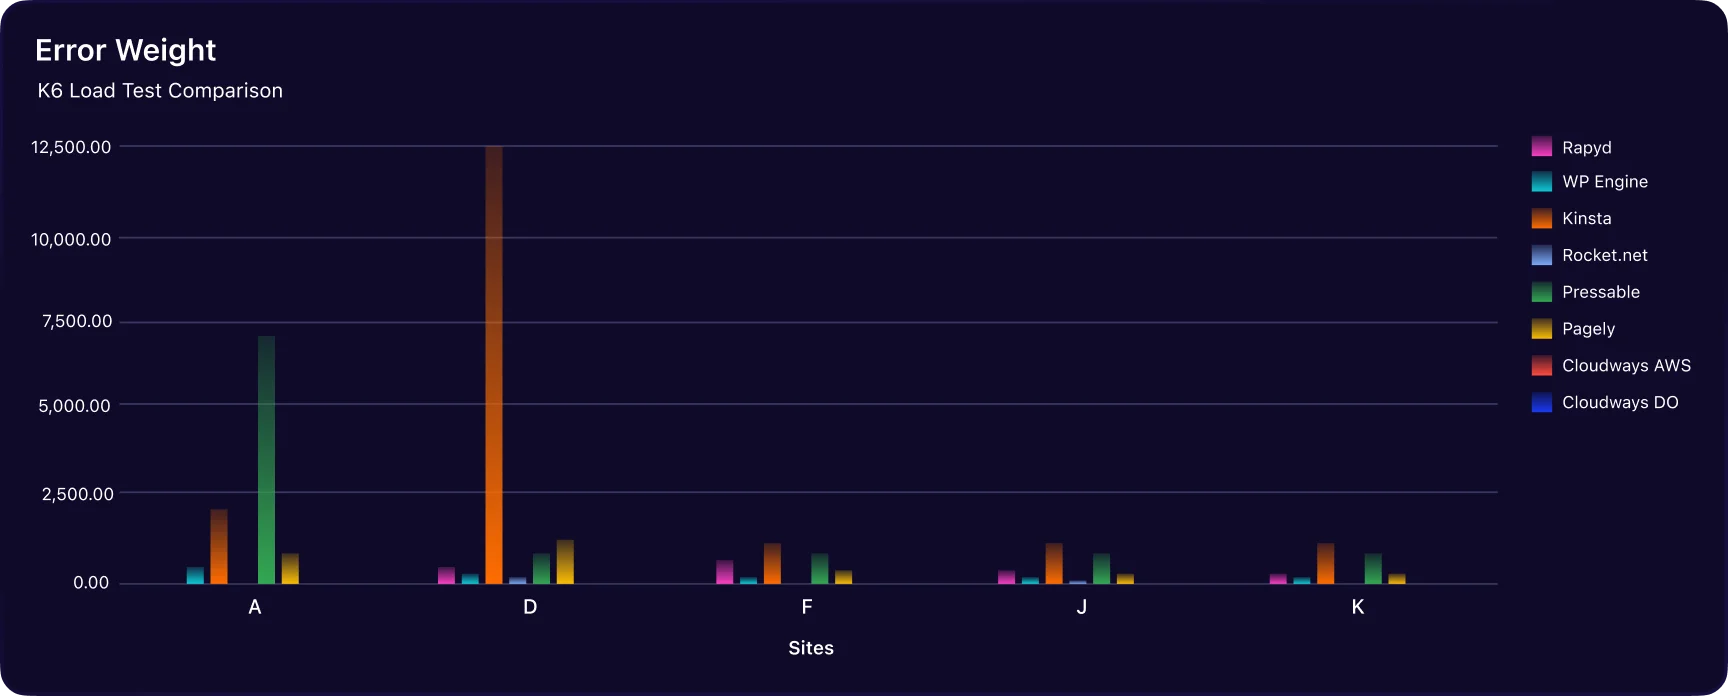
Errors arriving at the start of the test window are more severe than errors arriving later in the test window as such errors indicate that the server is less capable of handling dynamic loads.
These sorts of early errors can cause an imbalance in the Grafna reporting system as the requests start to fail completely ( with no response ) or with an empty page type response which looks to Grafna like a valid page – but with no content
The error weight reflects pages that don’t report an error but which contain no invalid content or an empty page.
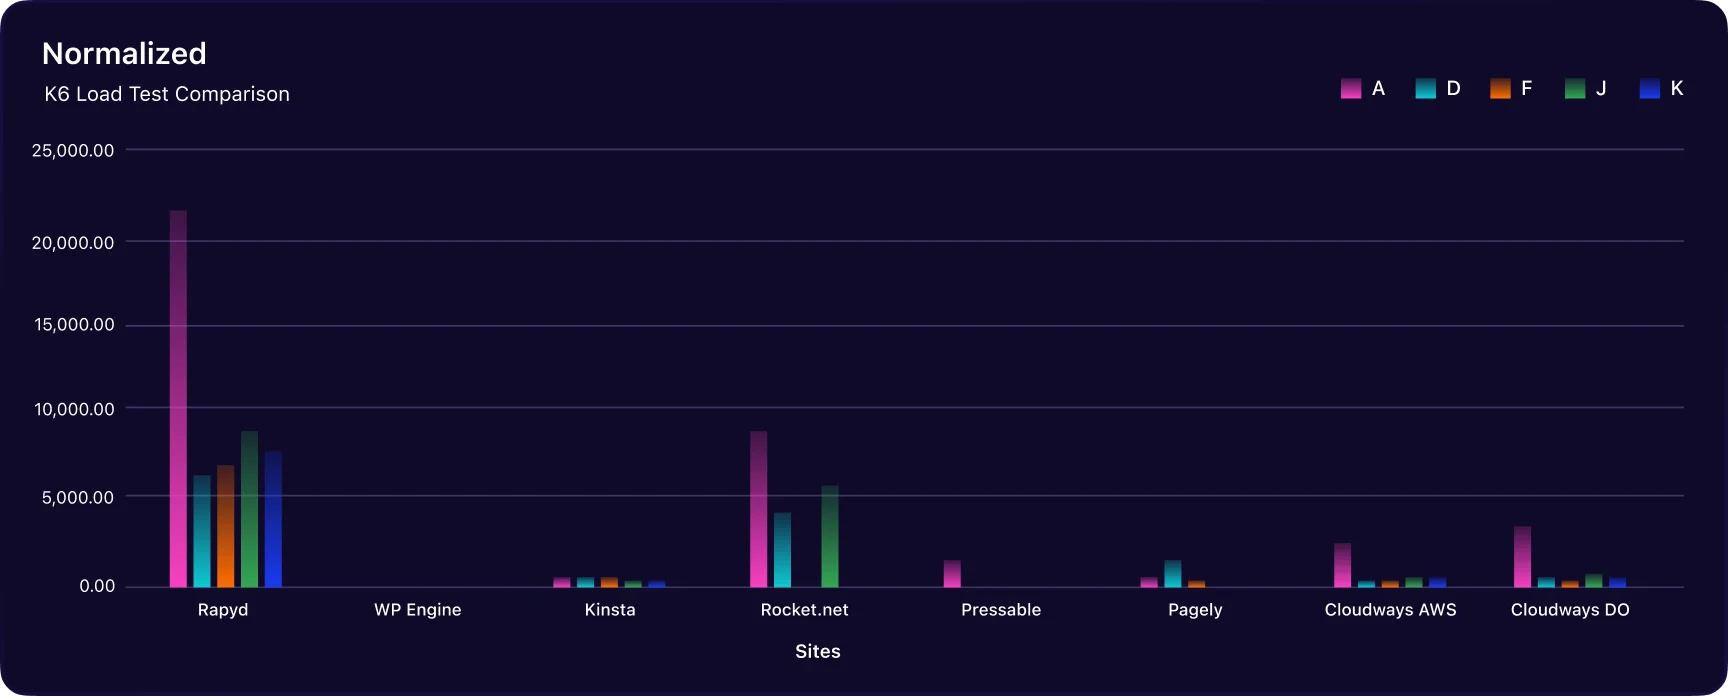
Taking all the information generated from the Grafna K6 test we create a normalized page request score for each test. This normalized score represents an estimation of successful page requests achieved within the test window, allowing for error and invalid page responses.
The higher the value the more successful page requests a server was able to process within the one minute test window.
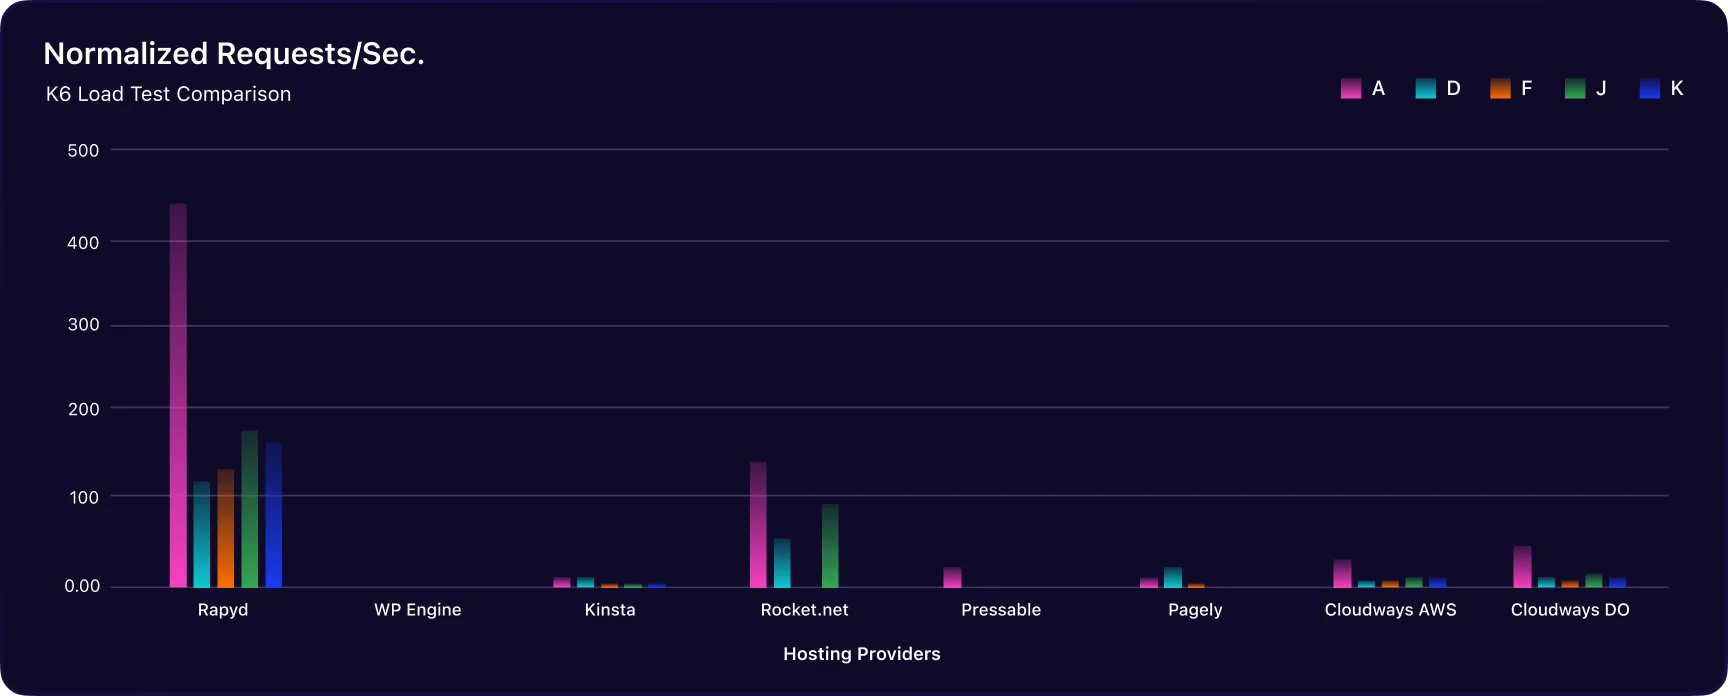
Based on the normalized requests processed within the test window, we then calculate an average possible page requests per second for the server. This calculation shows with some guidance the theoretical page requests per second any given hosting can achieve. Because this is a ramped load test, this number should be treated as a guidance. Many other factors can impact a server at runtime, but this number should be a realistic minimum achievable value.
Site A
List of Active Plugins:
OTHER DETAILS:
Site D
List of Active Plugins:
OTHER DETAILS:
BuddyBoss Components:
BuddyBoss App Components:
LearnDash
Site F
List of Active Plugins:
OTHER DETAILS:
BuddyBoss Components:
BuddyBoss App Components:
LearnDash
Site J
List of Active Plugins:
OTHER DETAILS:
BuddyBoss Components:
TUTOR LMS:
Site K
List of Active Plugins:
OTHER DETAILS:
Exceptional Performance
at Every Layer





Coming Soon


This is what success looks
like with Rapyd

KC360

GetAConnect

English Pro
 Supercharge Your WooCommerce Store


